New Features
Dashboard Analytics
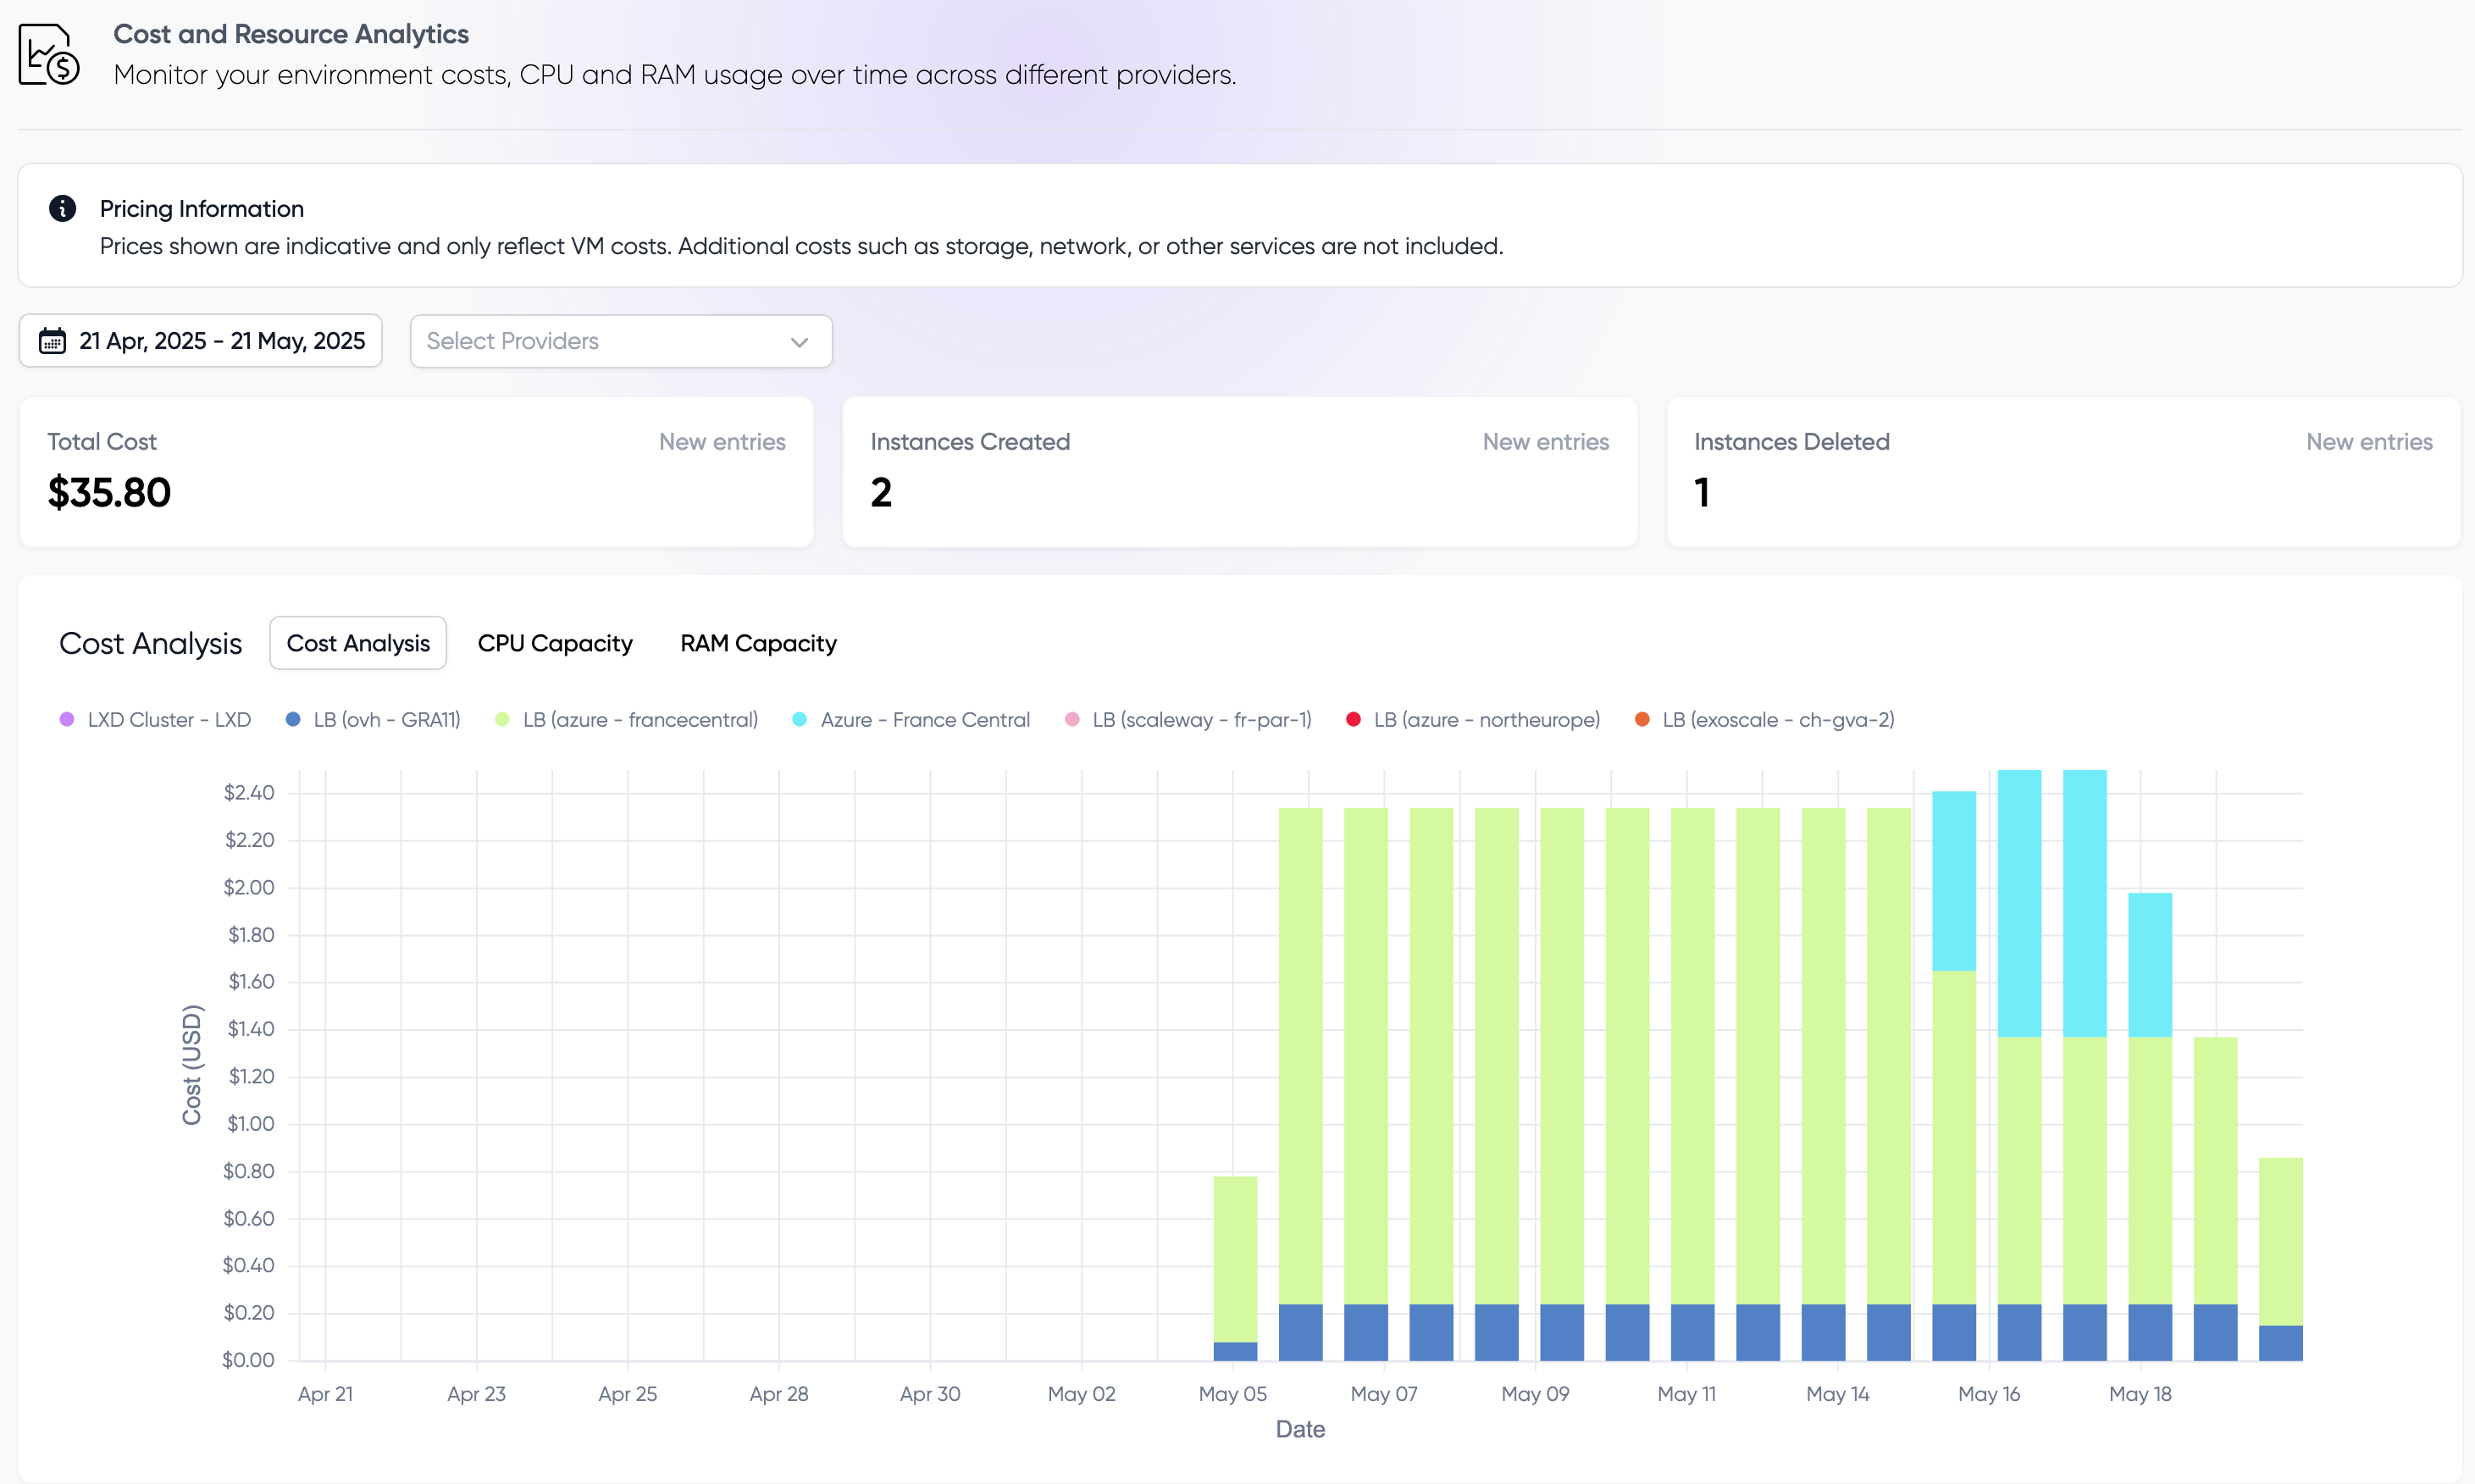
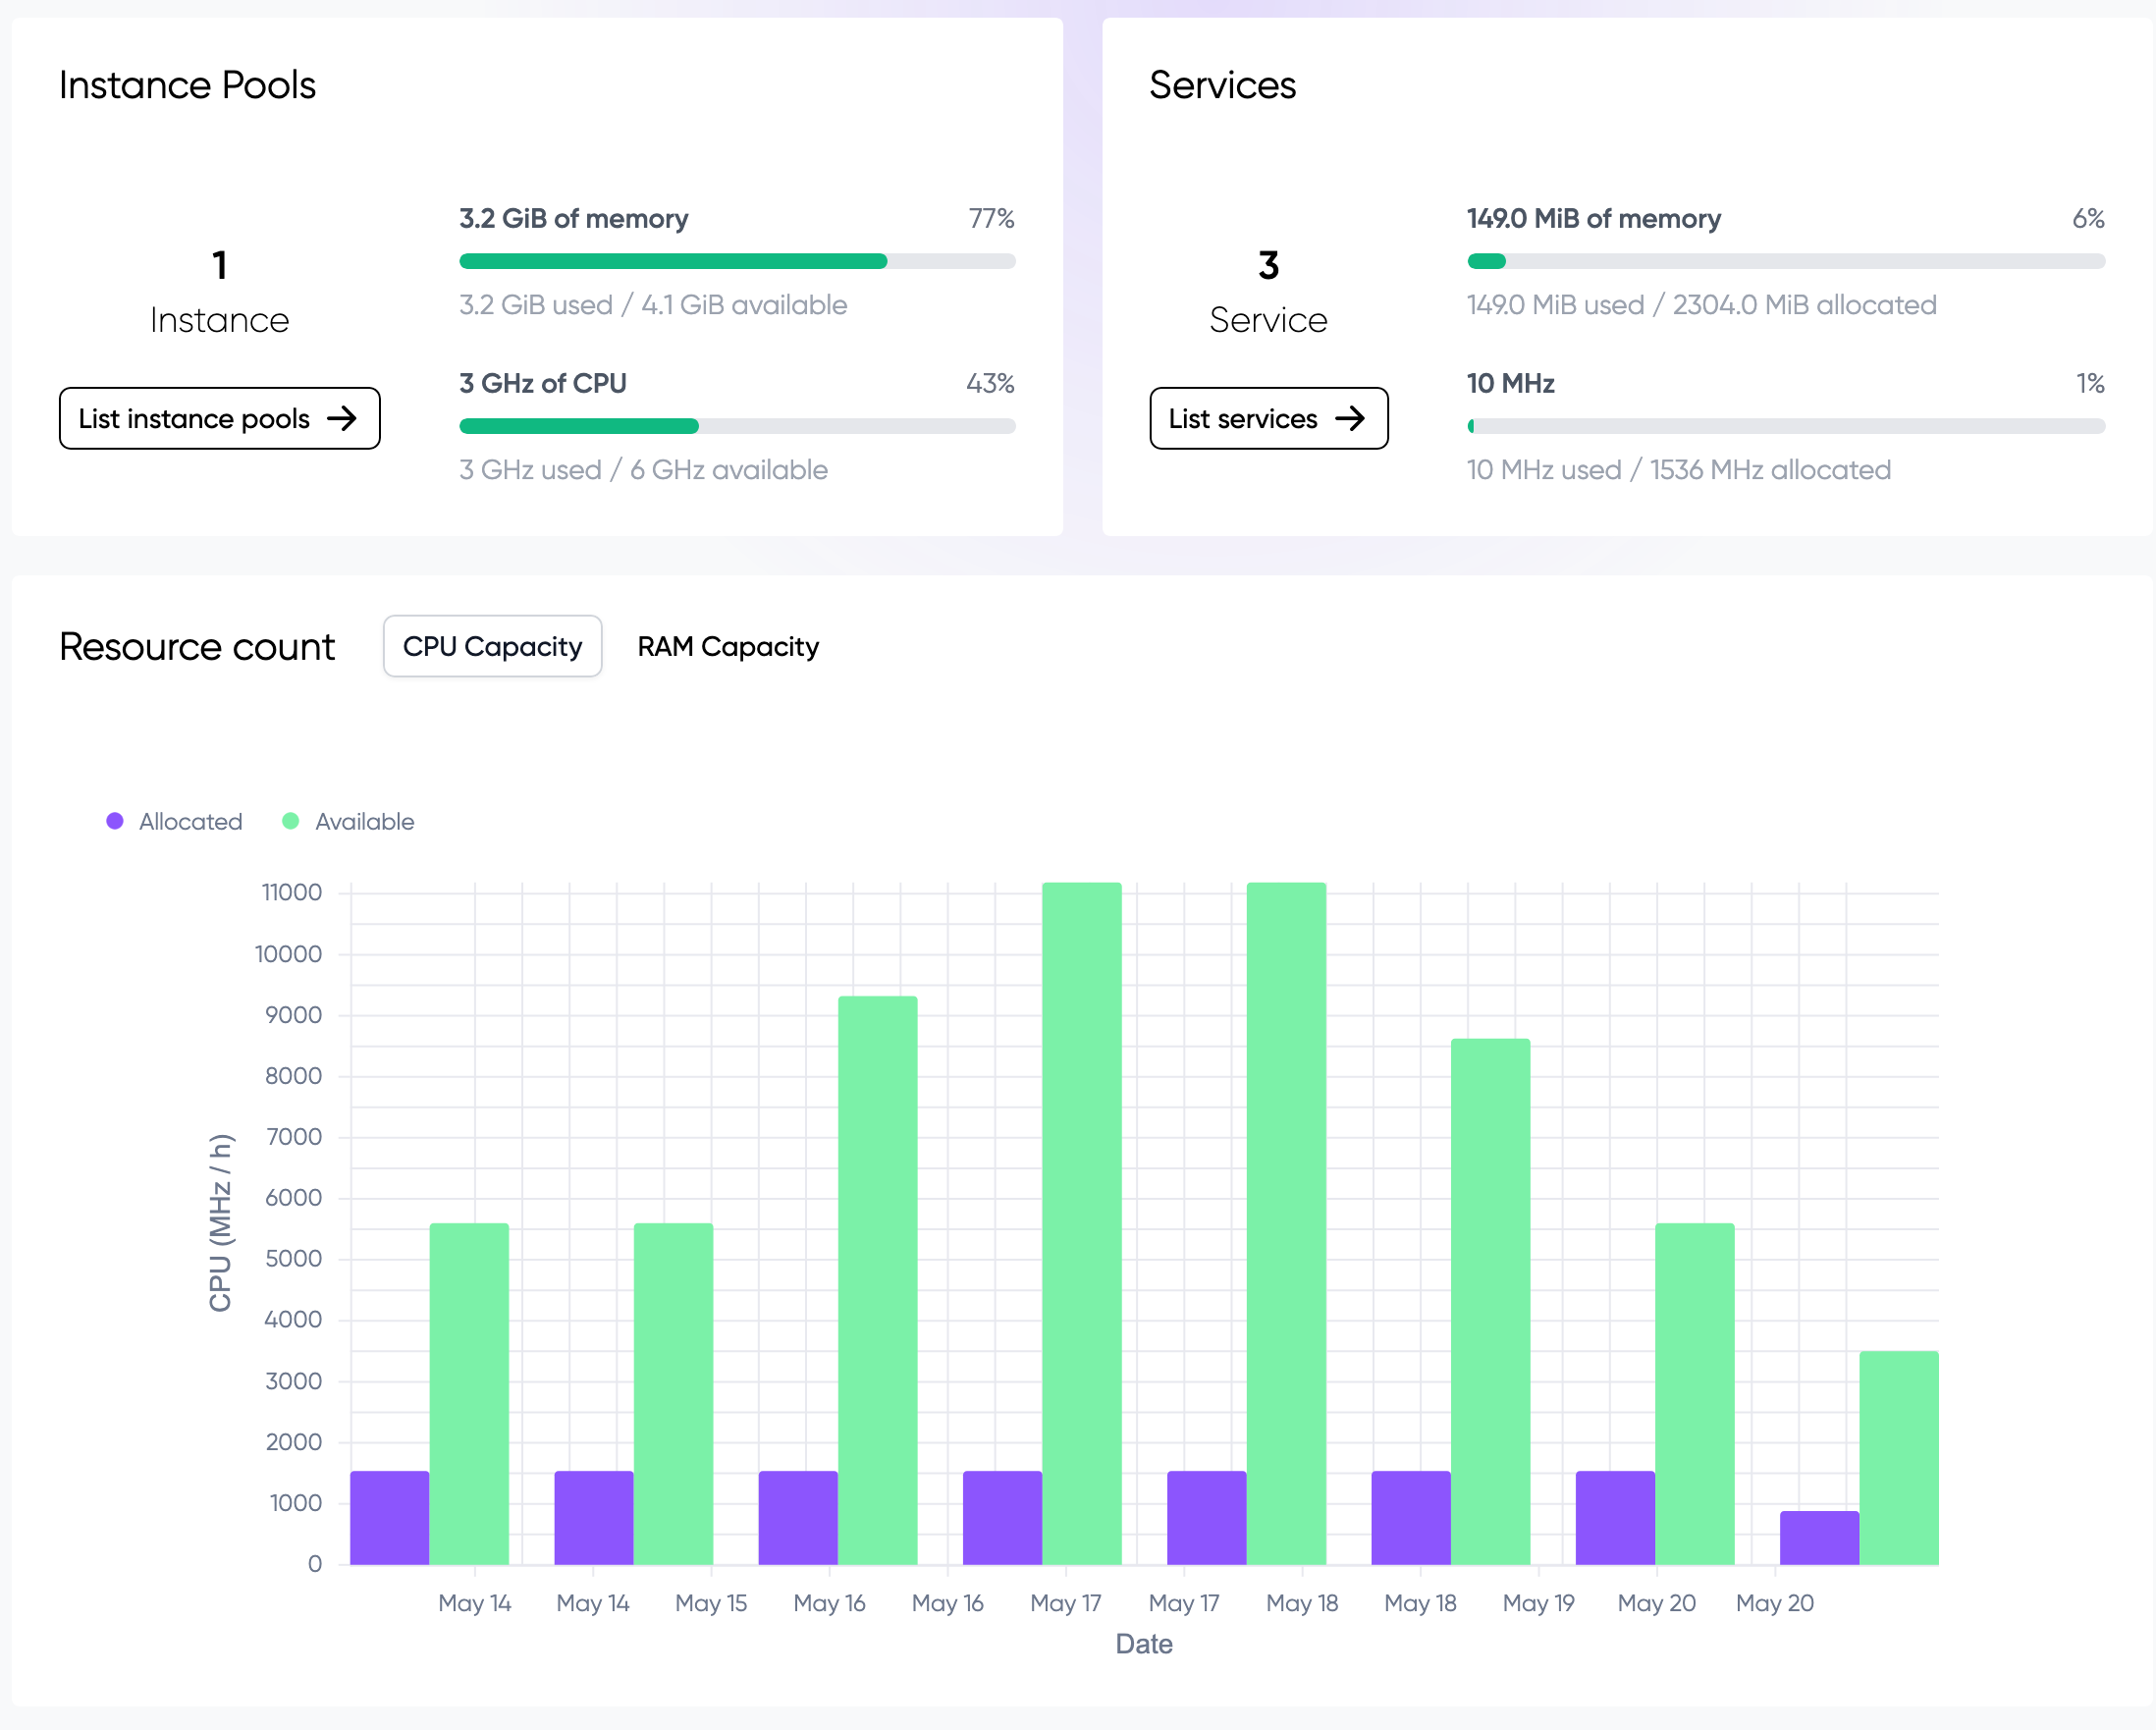
A comprehensive analytics dashboard is now available! Effortlessly monitor your environment costs, including VM and Load Balancer expenses, and track CPU/RAM capacity, both available and used, across your services.
The dashboard also lets you review historical usage and compare different time periods for deeper insights and smarter scaling decisions.
A preview of available and used capacity is now visible in the environment overview for all plans, giving every team quick access to their resource status.
Load Balancer: Custom Ports & Protocols
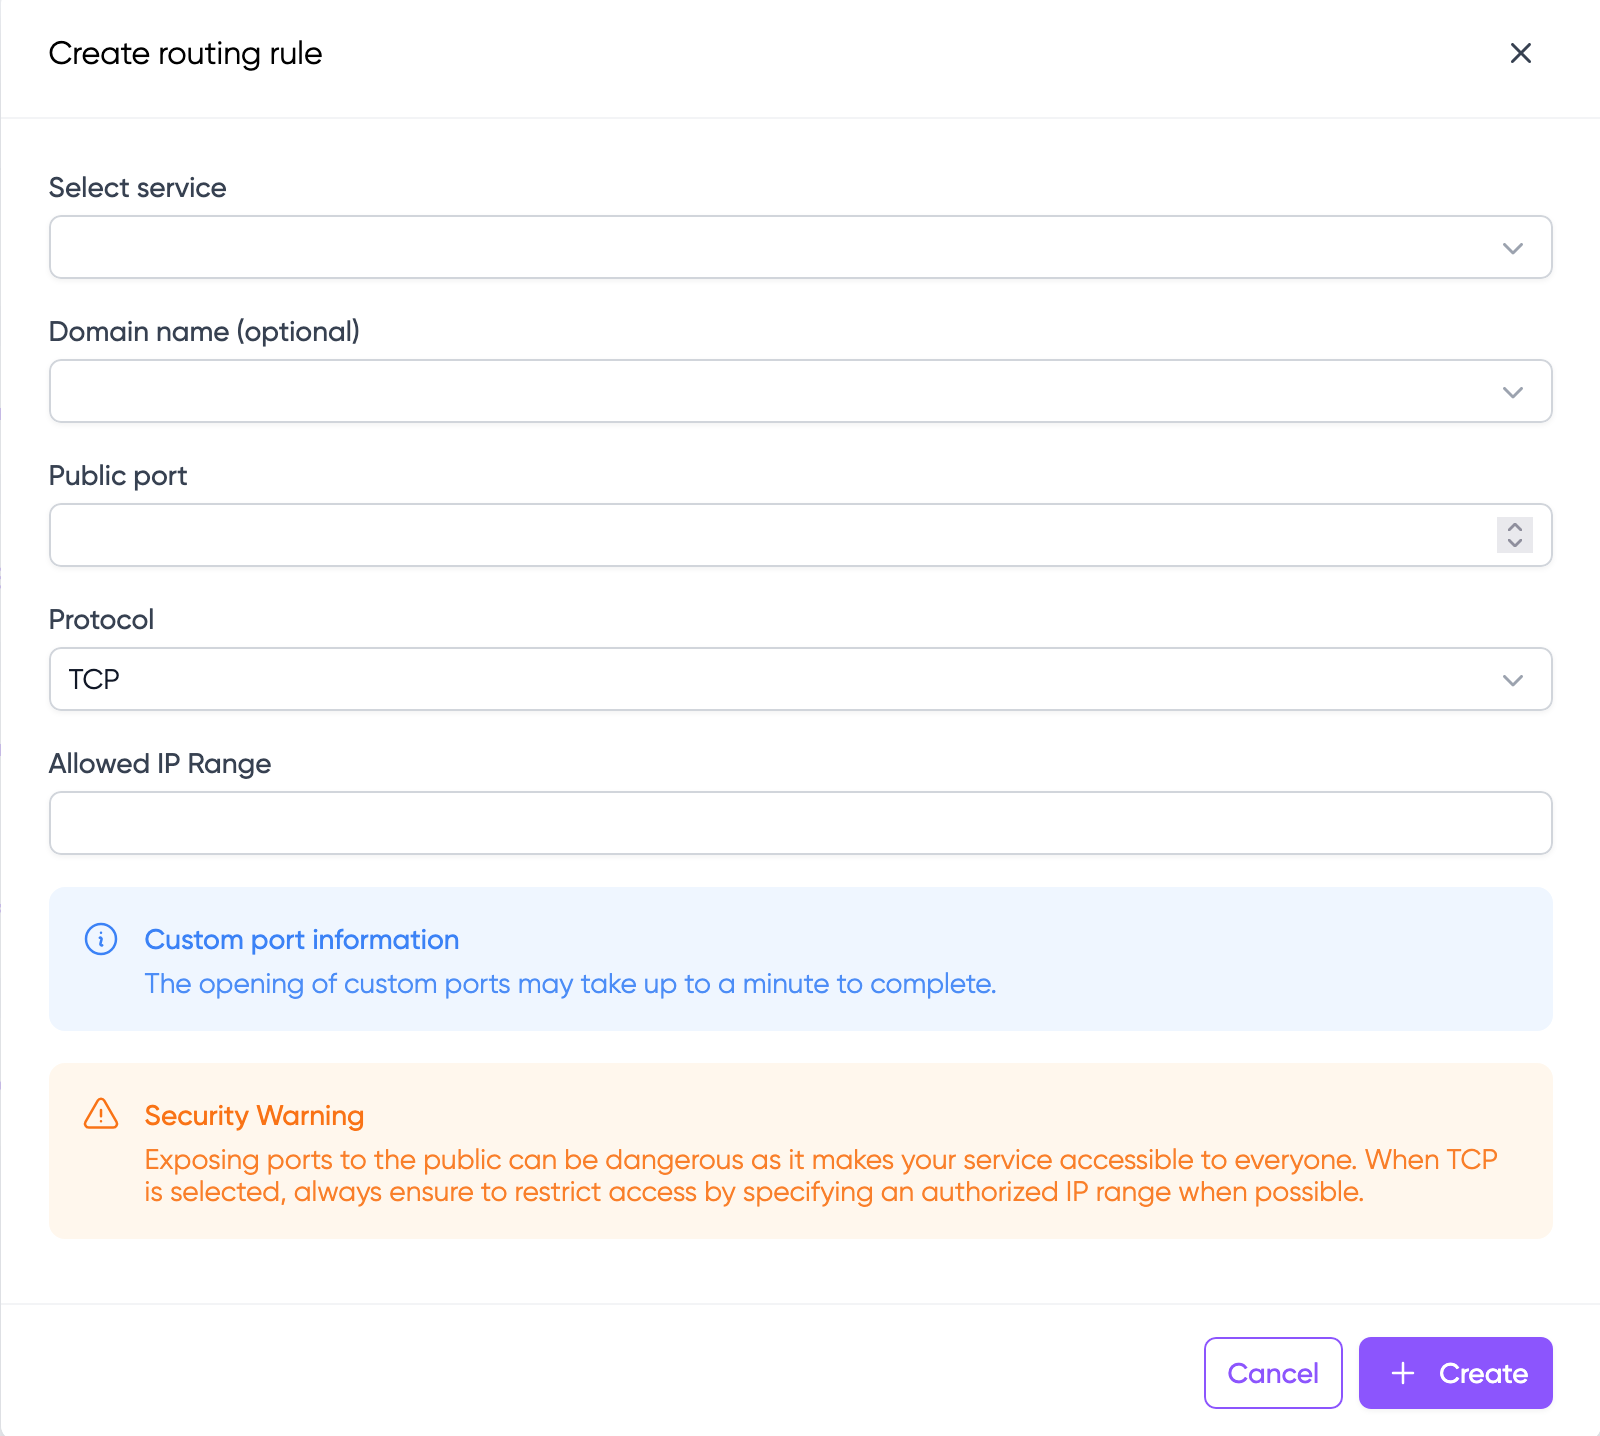
You can now add rules to Load Balancers for both TCP and UDP protocols, directly targeting your services. This means you can expose services over UDP and manage rules just as you do for other protocols.
Event List
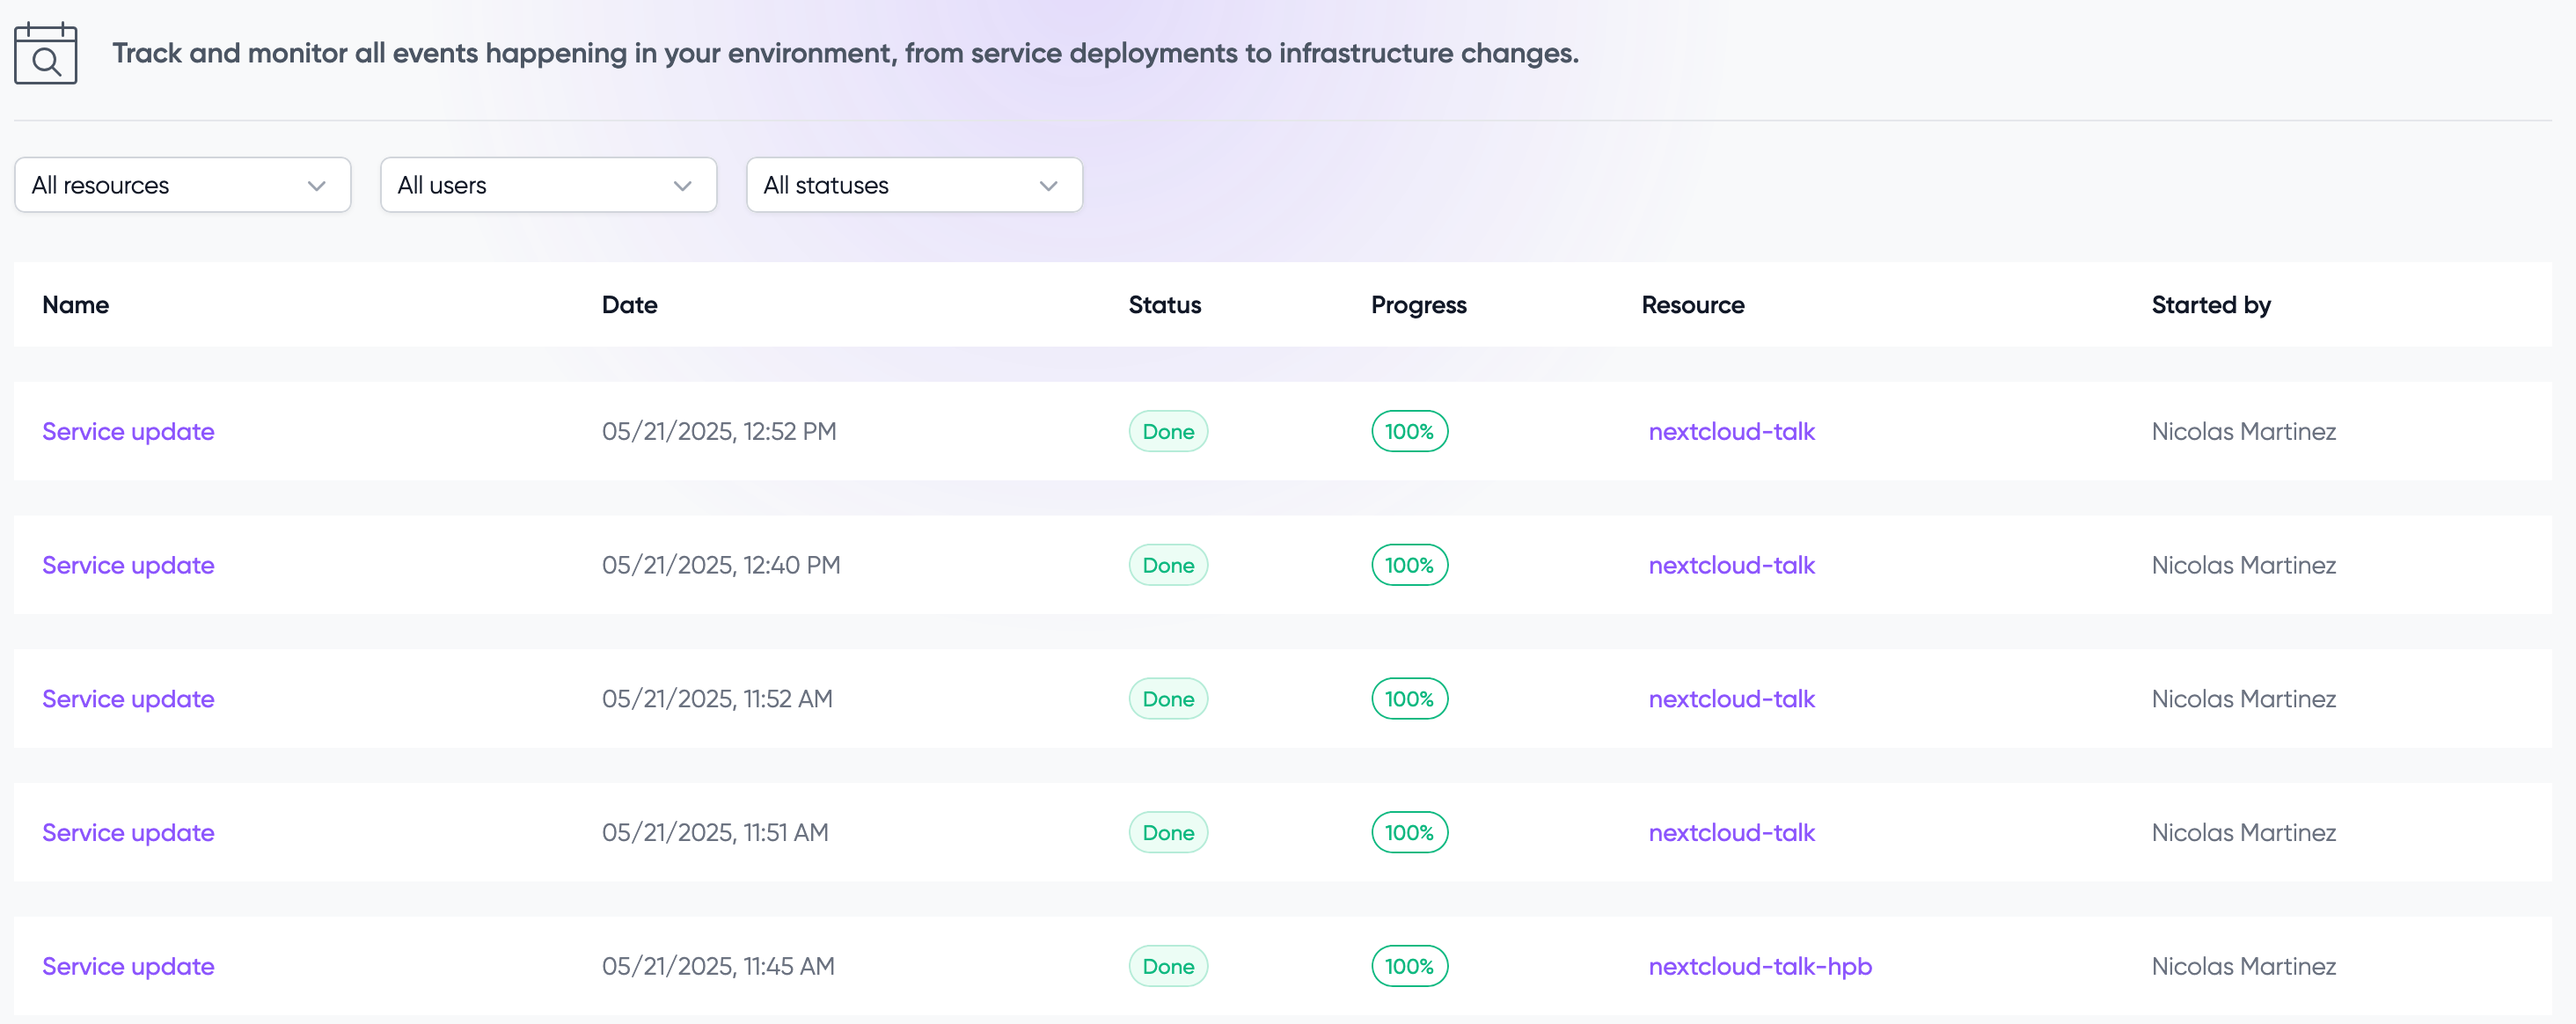
All environment events are now accessible from a dedicated page, providing a clear overview of what's happening in your environment.
Improvements
- Refactored VPN architecture for improved service-to-service communication latency
- Improved error display for CRON services
- Ability to use variables in database backup configuration